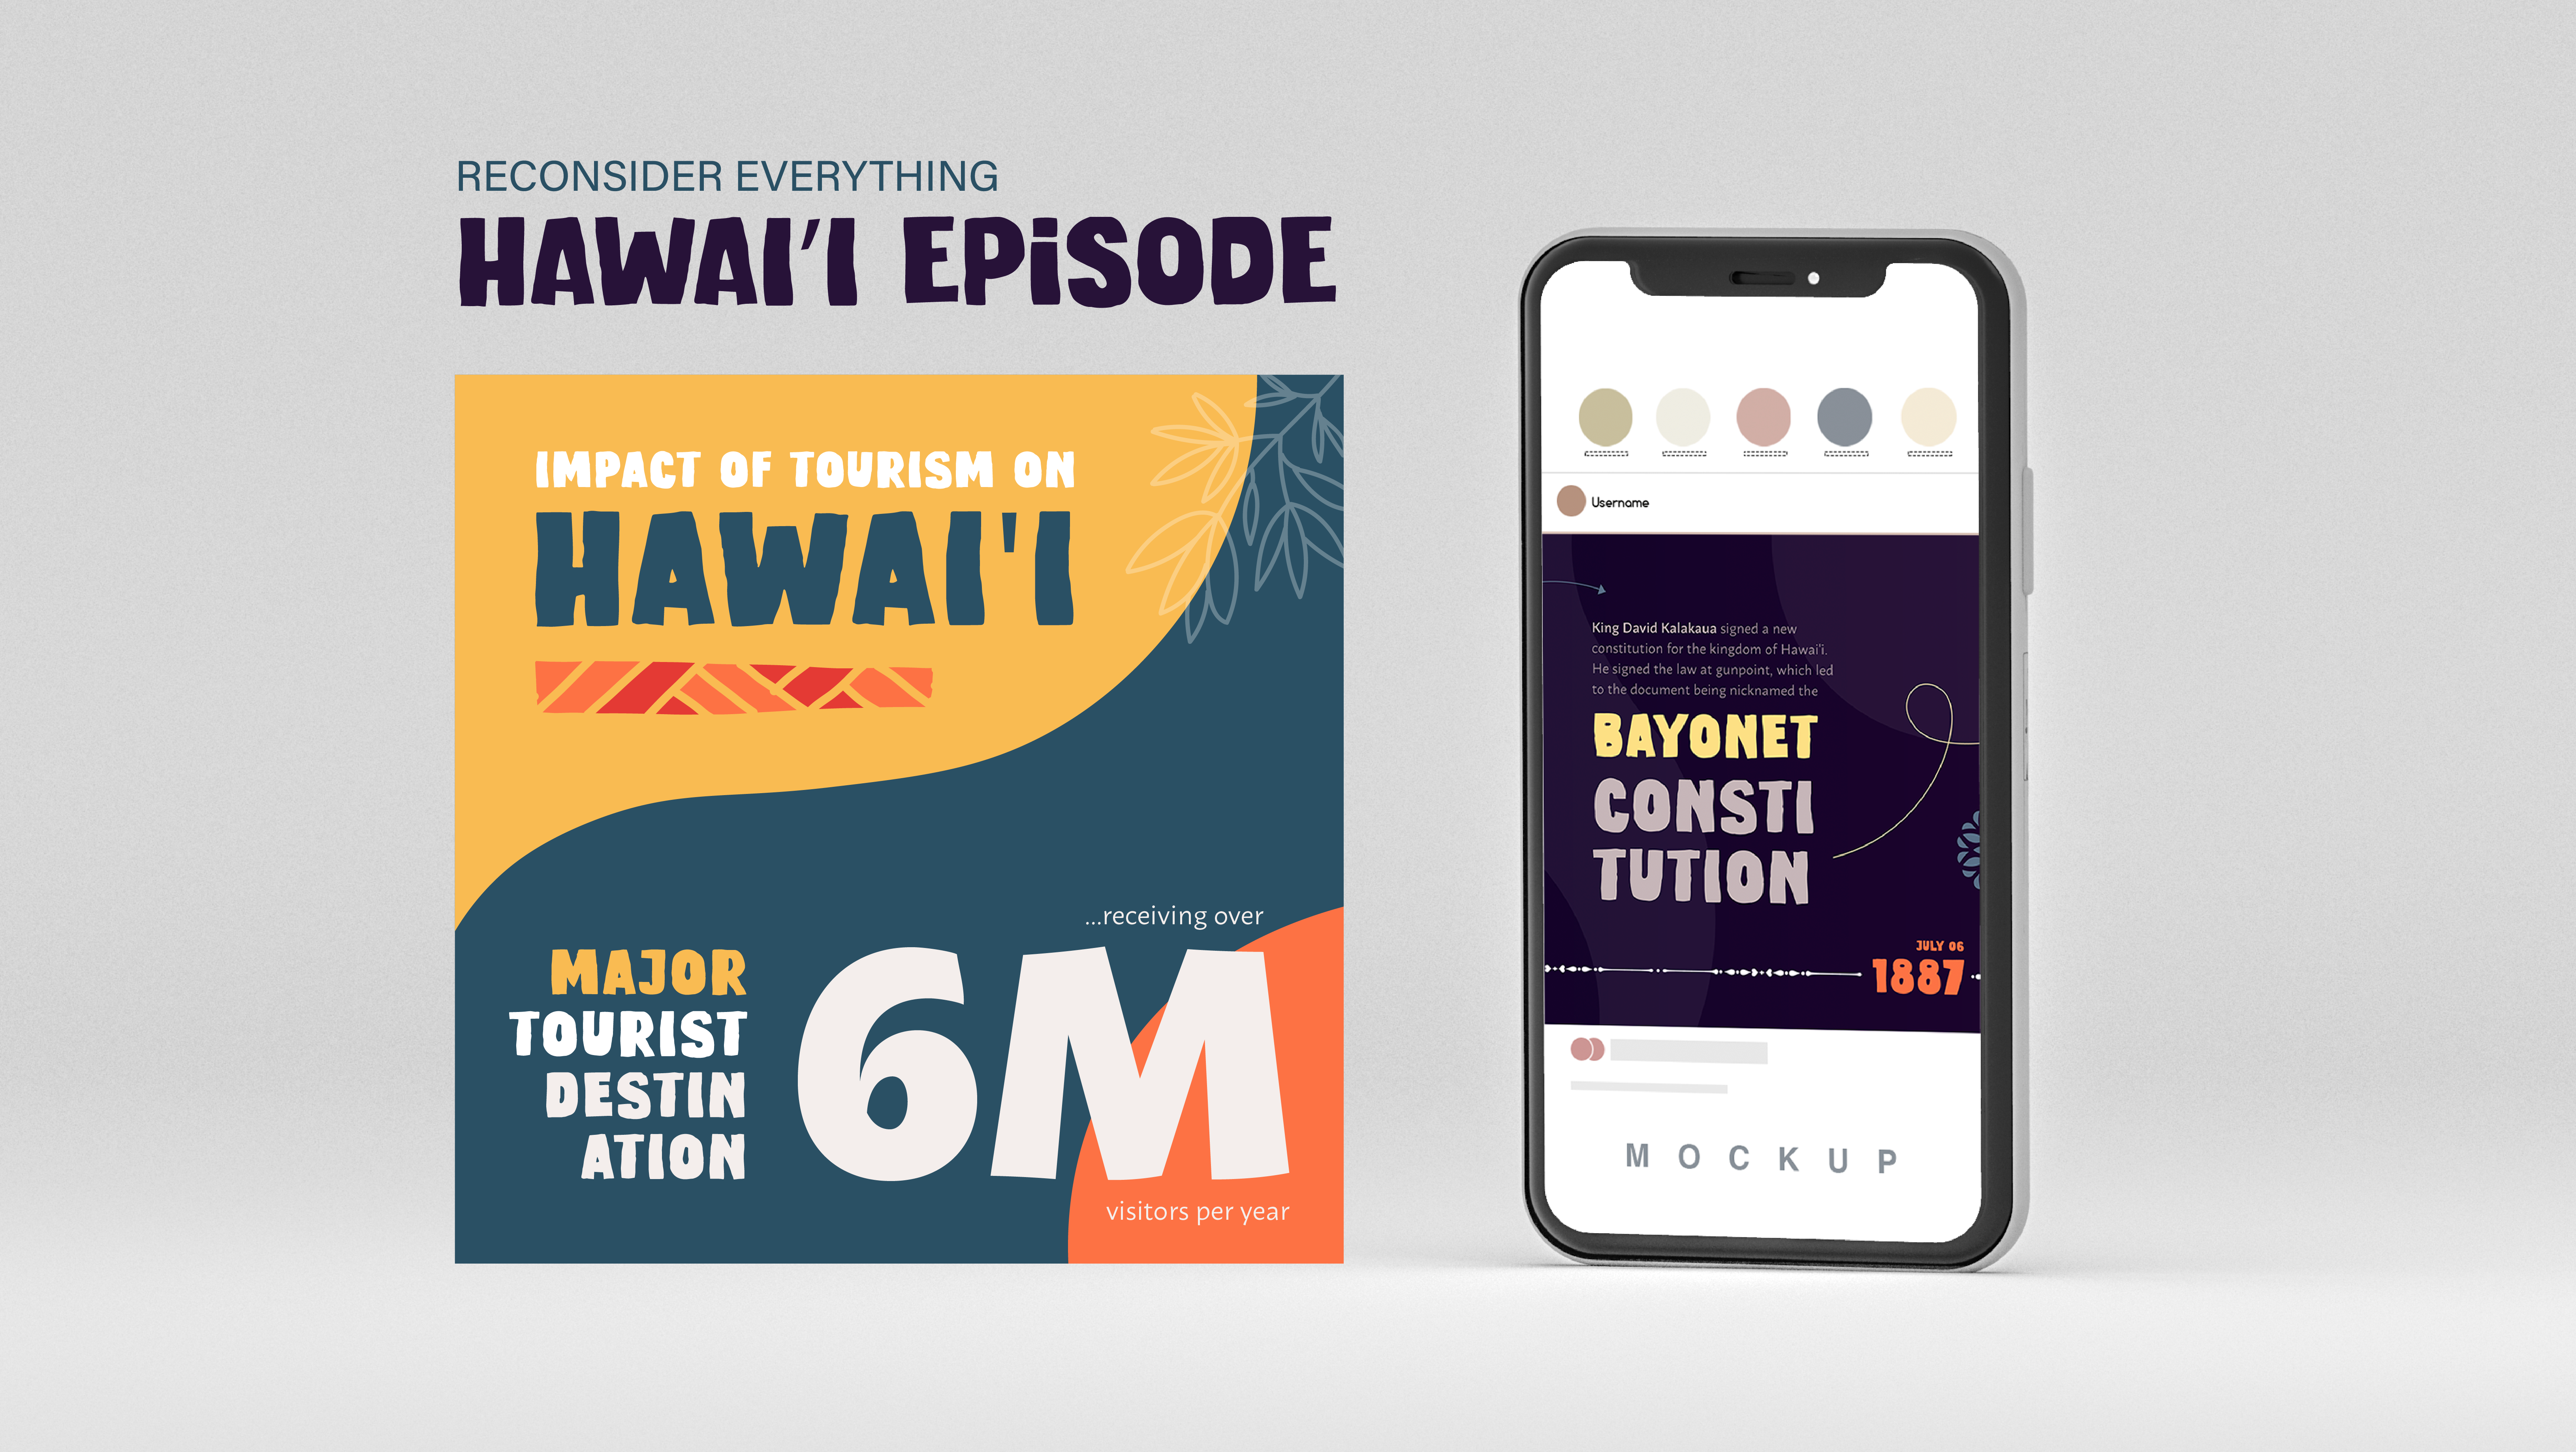
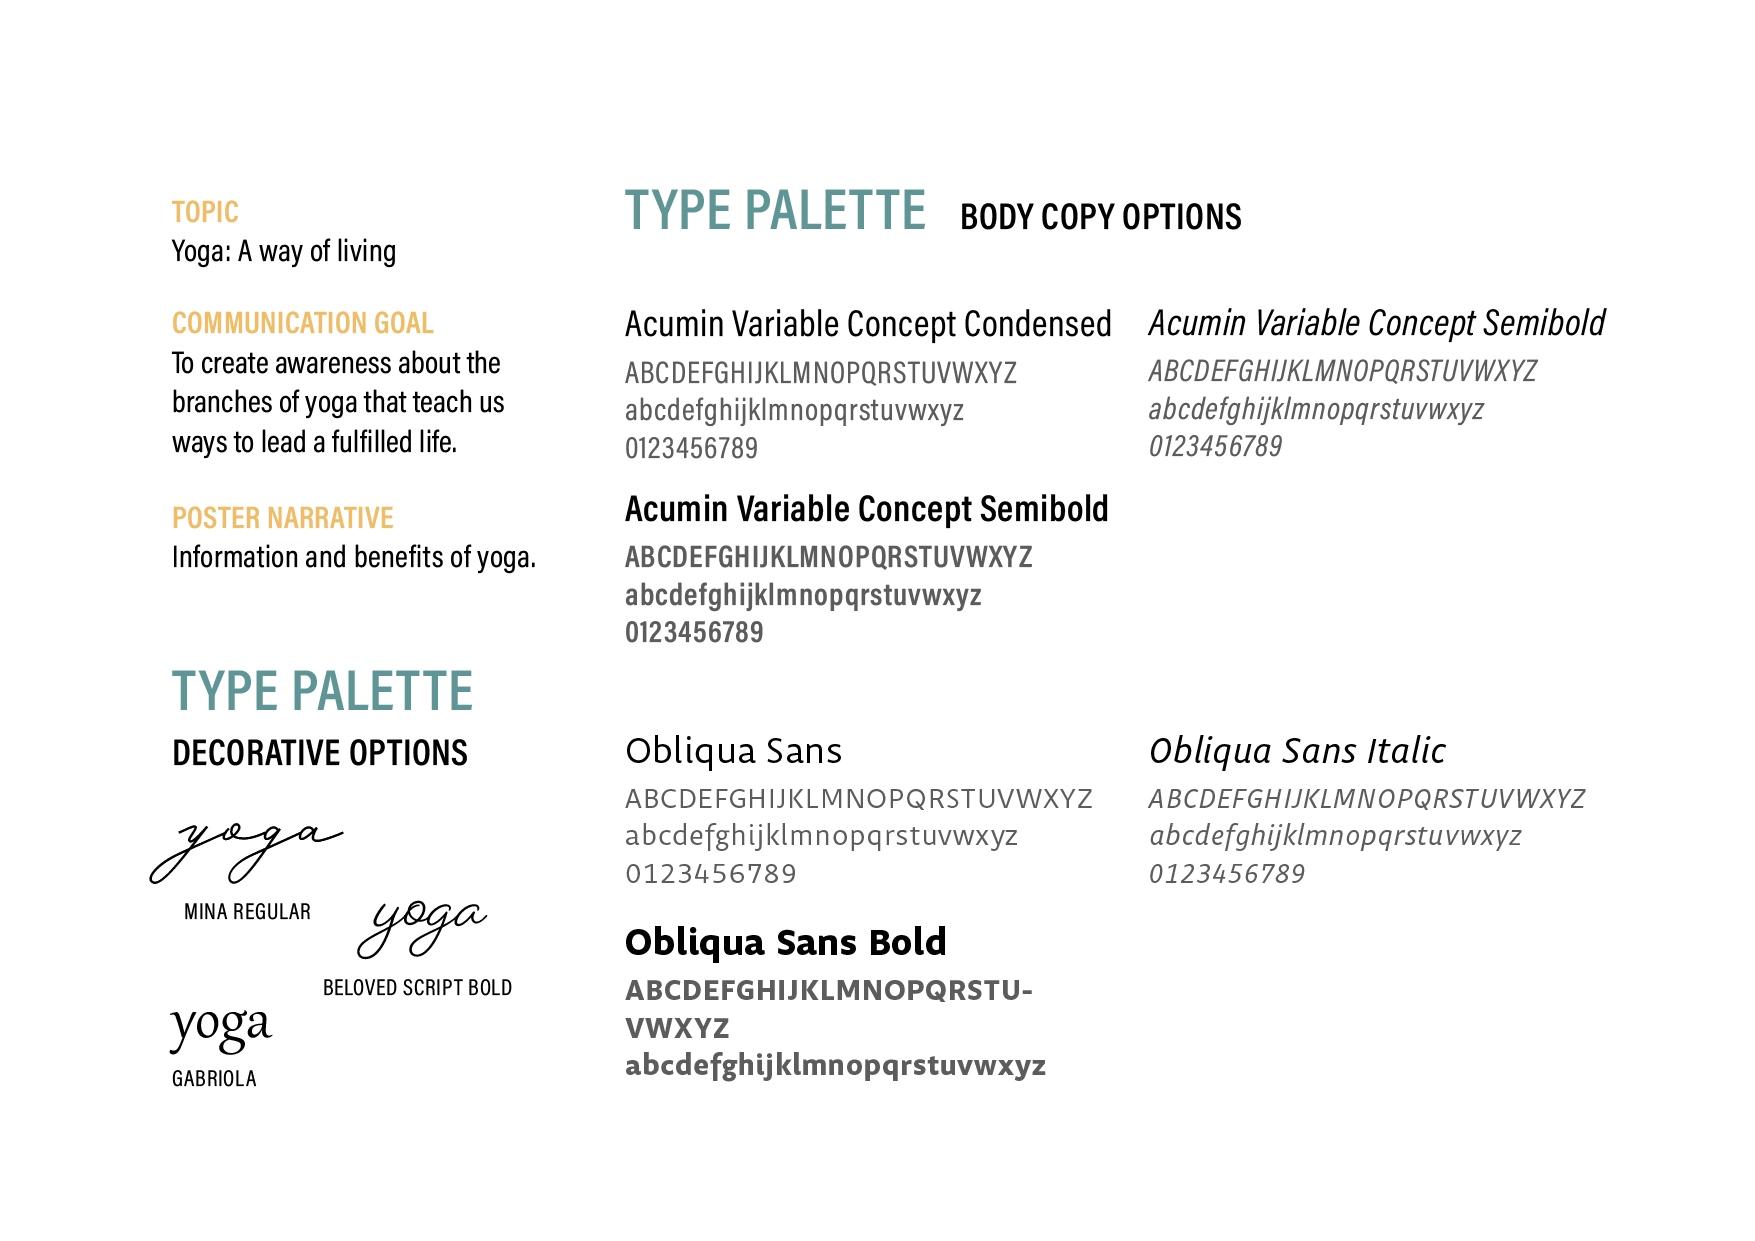
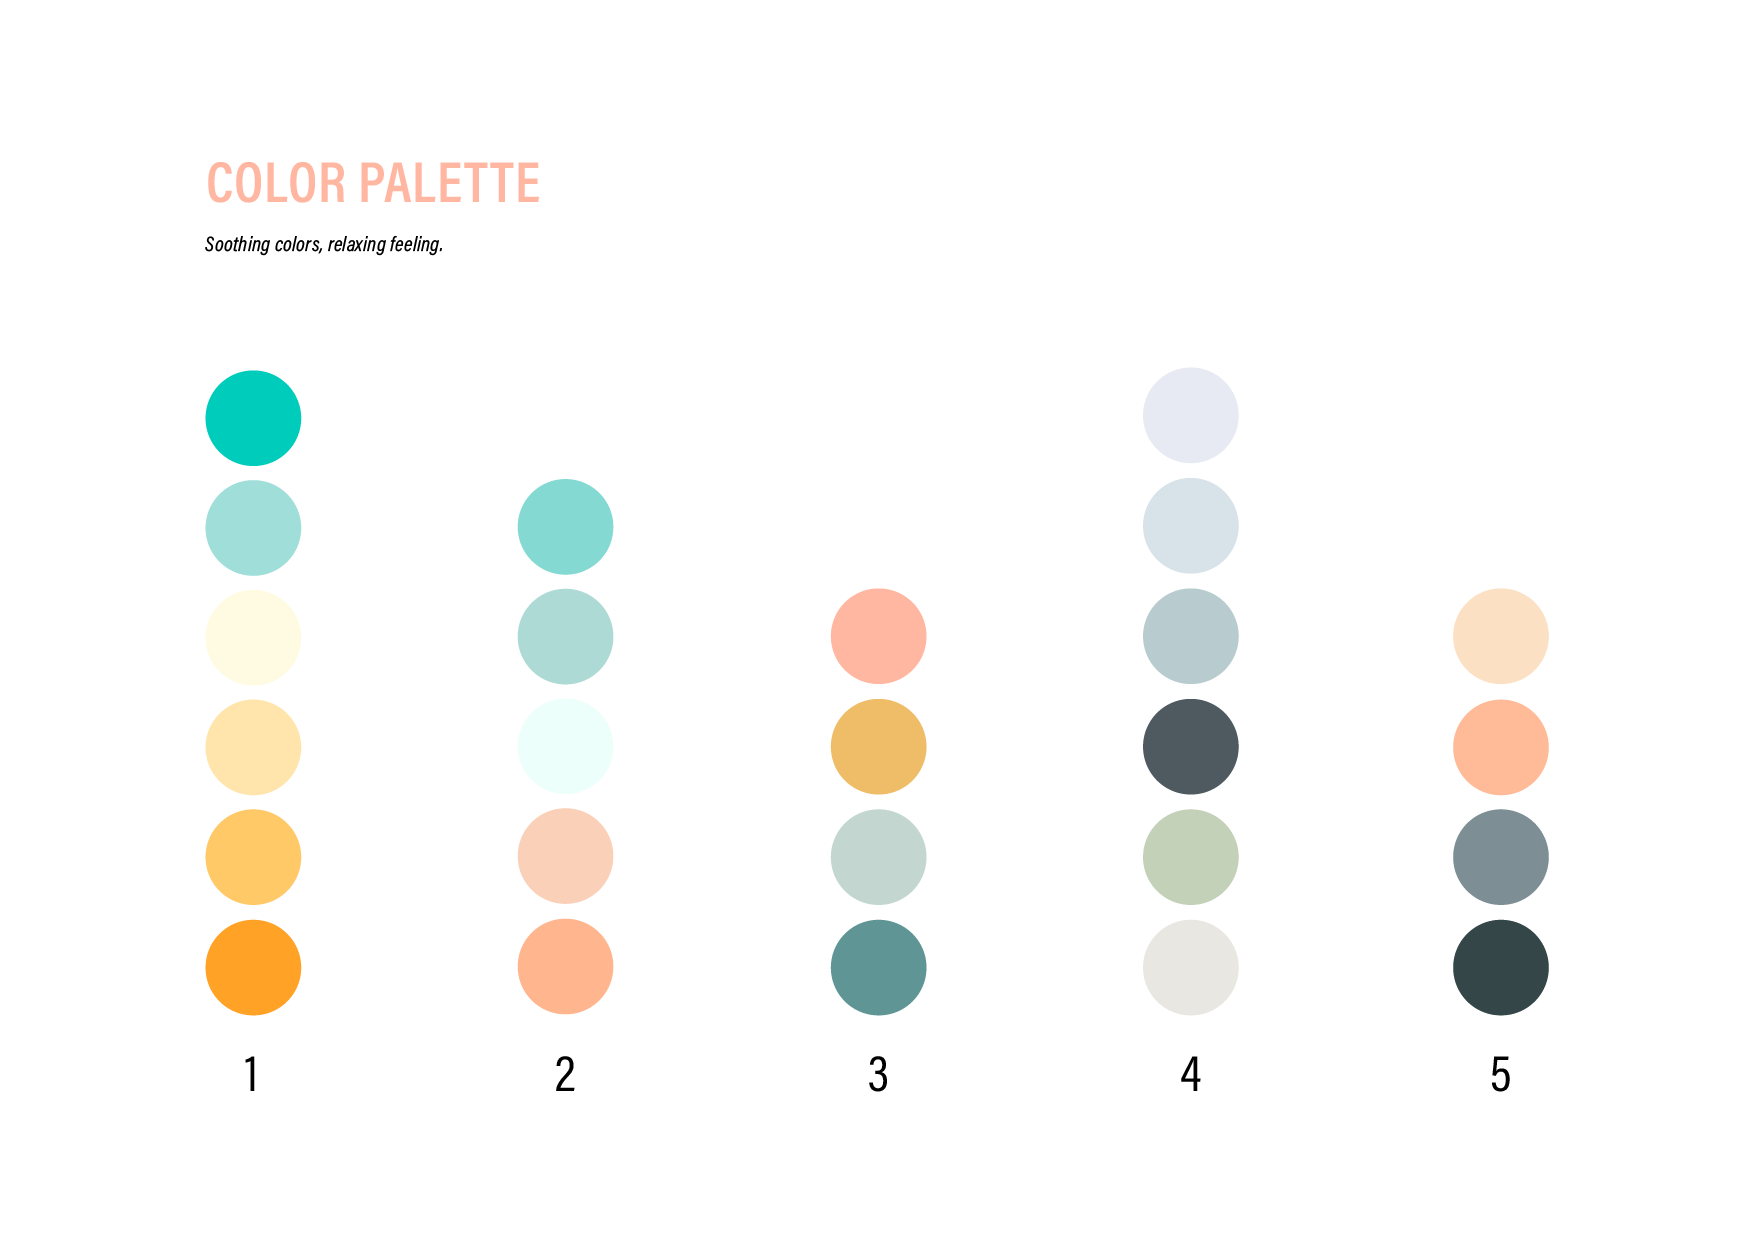
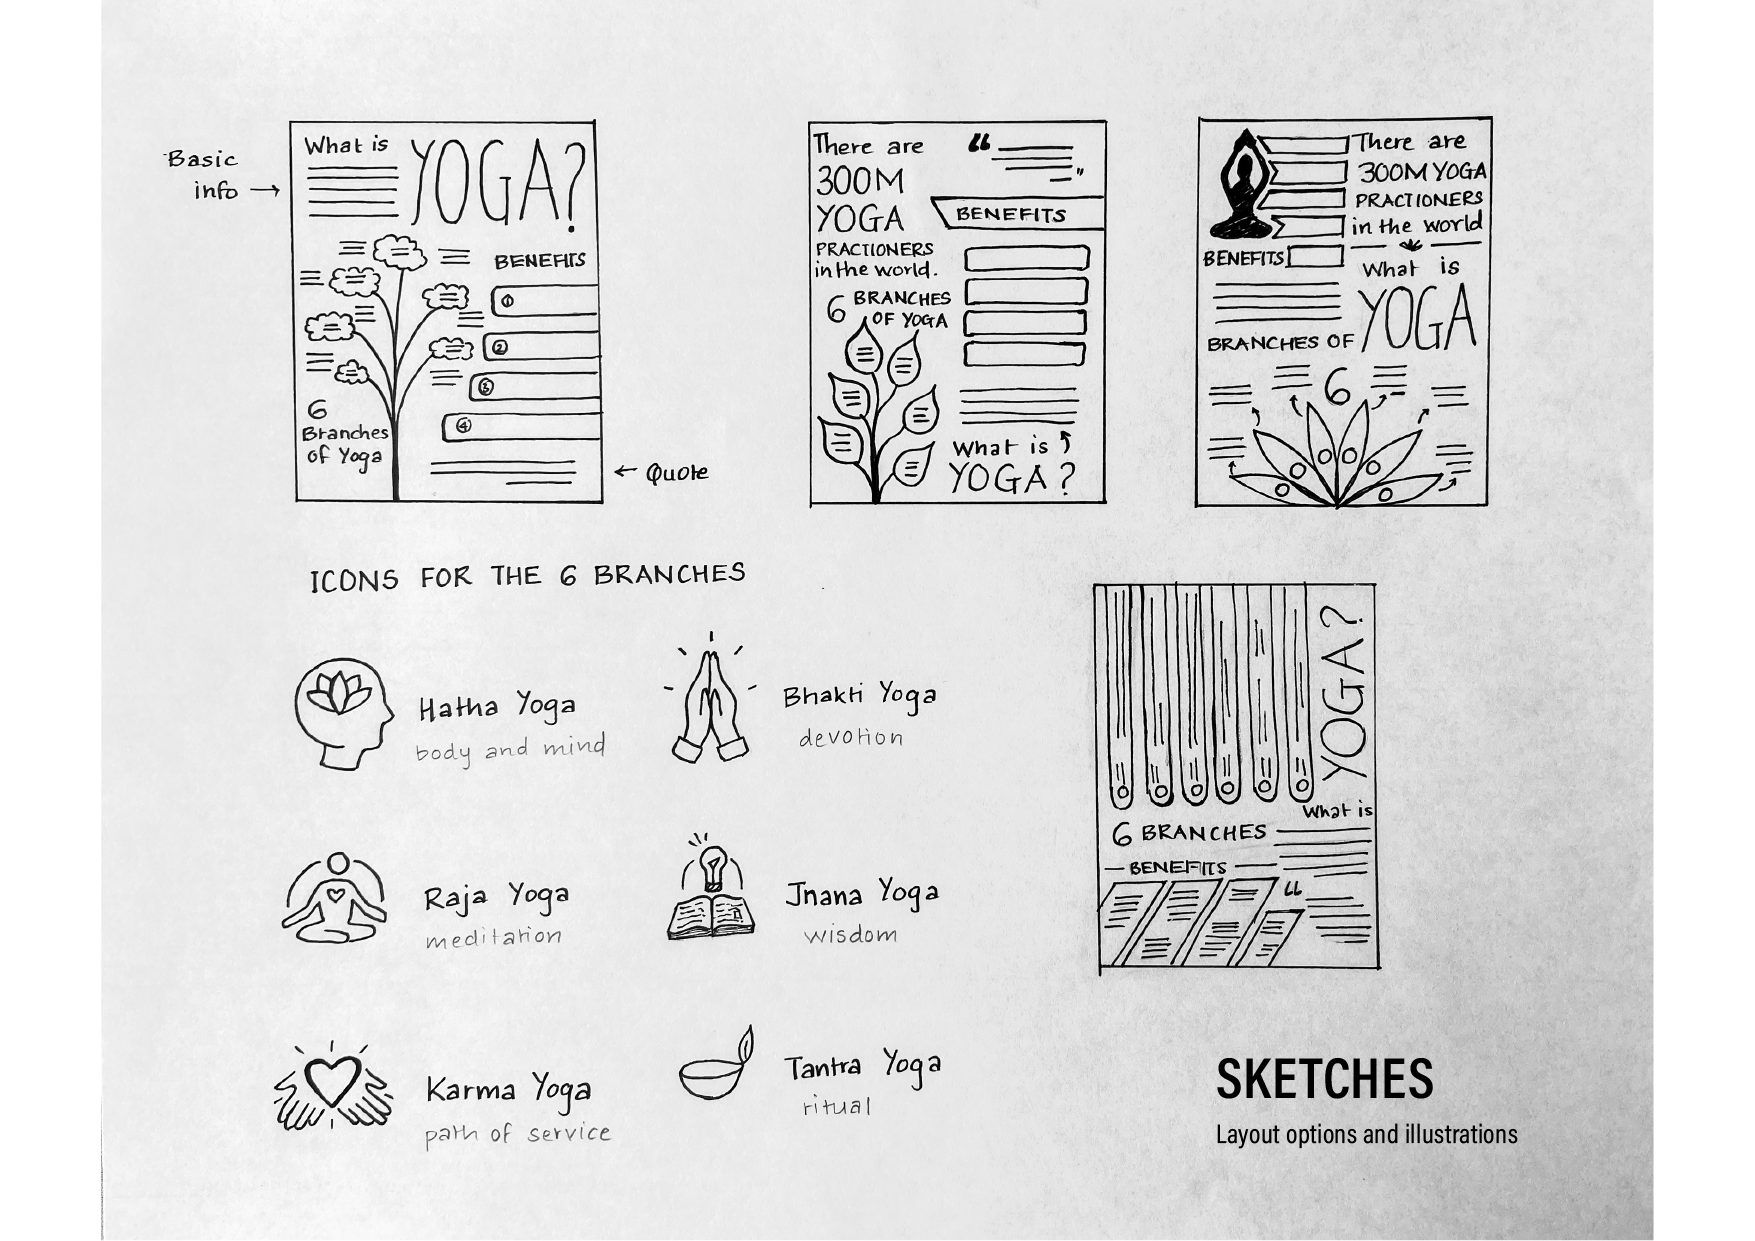

This project focused on collecting and making sense of data for a topic of choice to visualize on the infographic through diverging, affinity diagramming, sorting, and converging. The design process then proceeded with some rough sketches for the layout of the infographic and deciding on the type and color palette.